One of the things that I struggled with going from eclipse and Visual Studio to xCode was the the debugger. Most of the objects have memory references rather than values. For a long time while developing iOS apps all i would get, or though I had was one cryptic error message. Till I discovered po which stands for print object. This allowed me to print out the contents of an object which can be very useful.
Here is list of gdb commands: (Warning properties are not identified by the debugger so dont use anything with dot notation)
po – print object – can be used to print out the likes of NSStrings and NSDictionaries
use: po someObject
print – prints base types – used to print out to the screen ints floats and the like
use: print myFloat
set – set a variable – allows you to set variables
use: set someString=@”test”
call – calls a method – can be used to call methods or the properties getters and setters
use: – call [someObjectInstance withString:@”newString”];
n – Next – always you to travers your code during breck
use: n
There are 2 main places you can use the commands.
The first is the consol output during a break or crash just after the gdb:

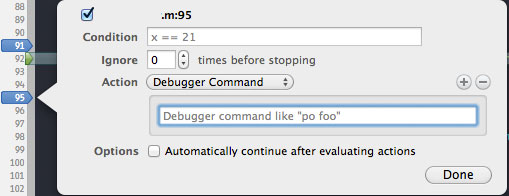
The second is in a break point first set a break point then click the “Click to add action text” ass seen bellow.

Now you can add you command in the newly available text field that will always be triggered at that point in the code.

Carful with the break point triggers not to confuse your self if you put sets or calls in there.